SkySpark Floorplan Data and Graphic Integration for City Furniture
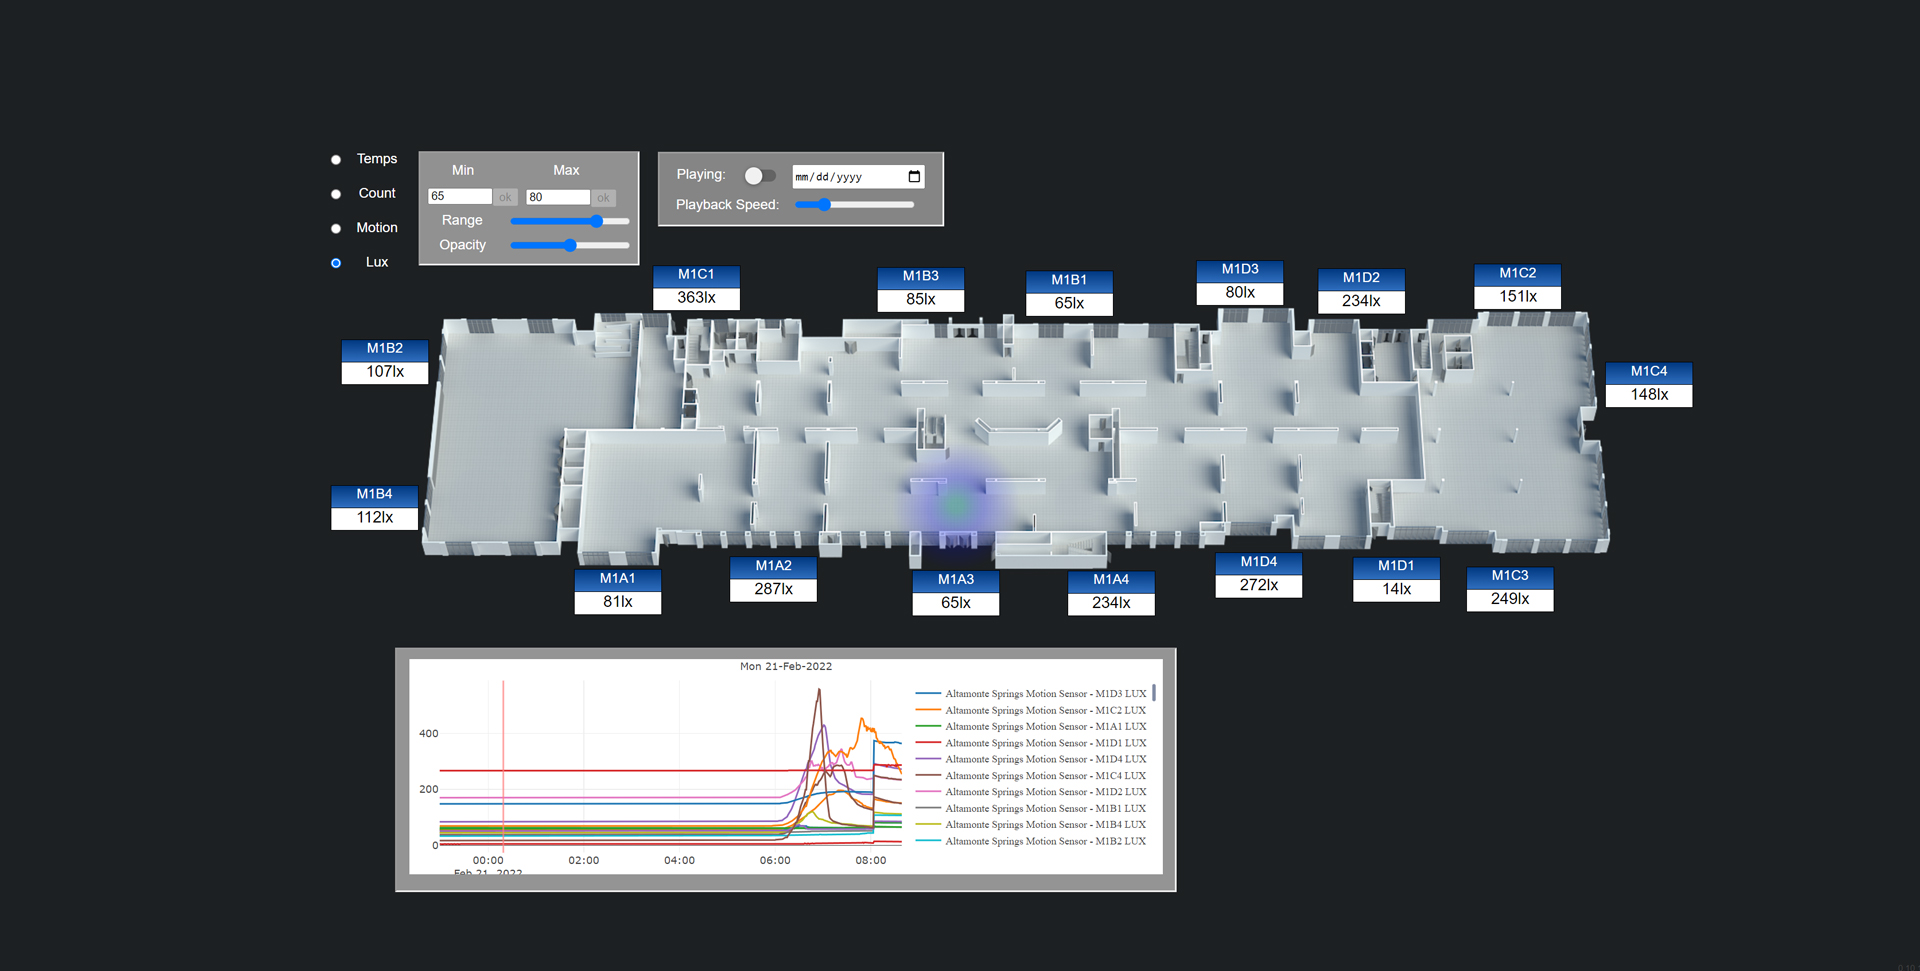
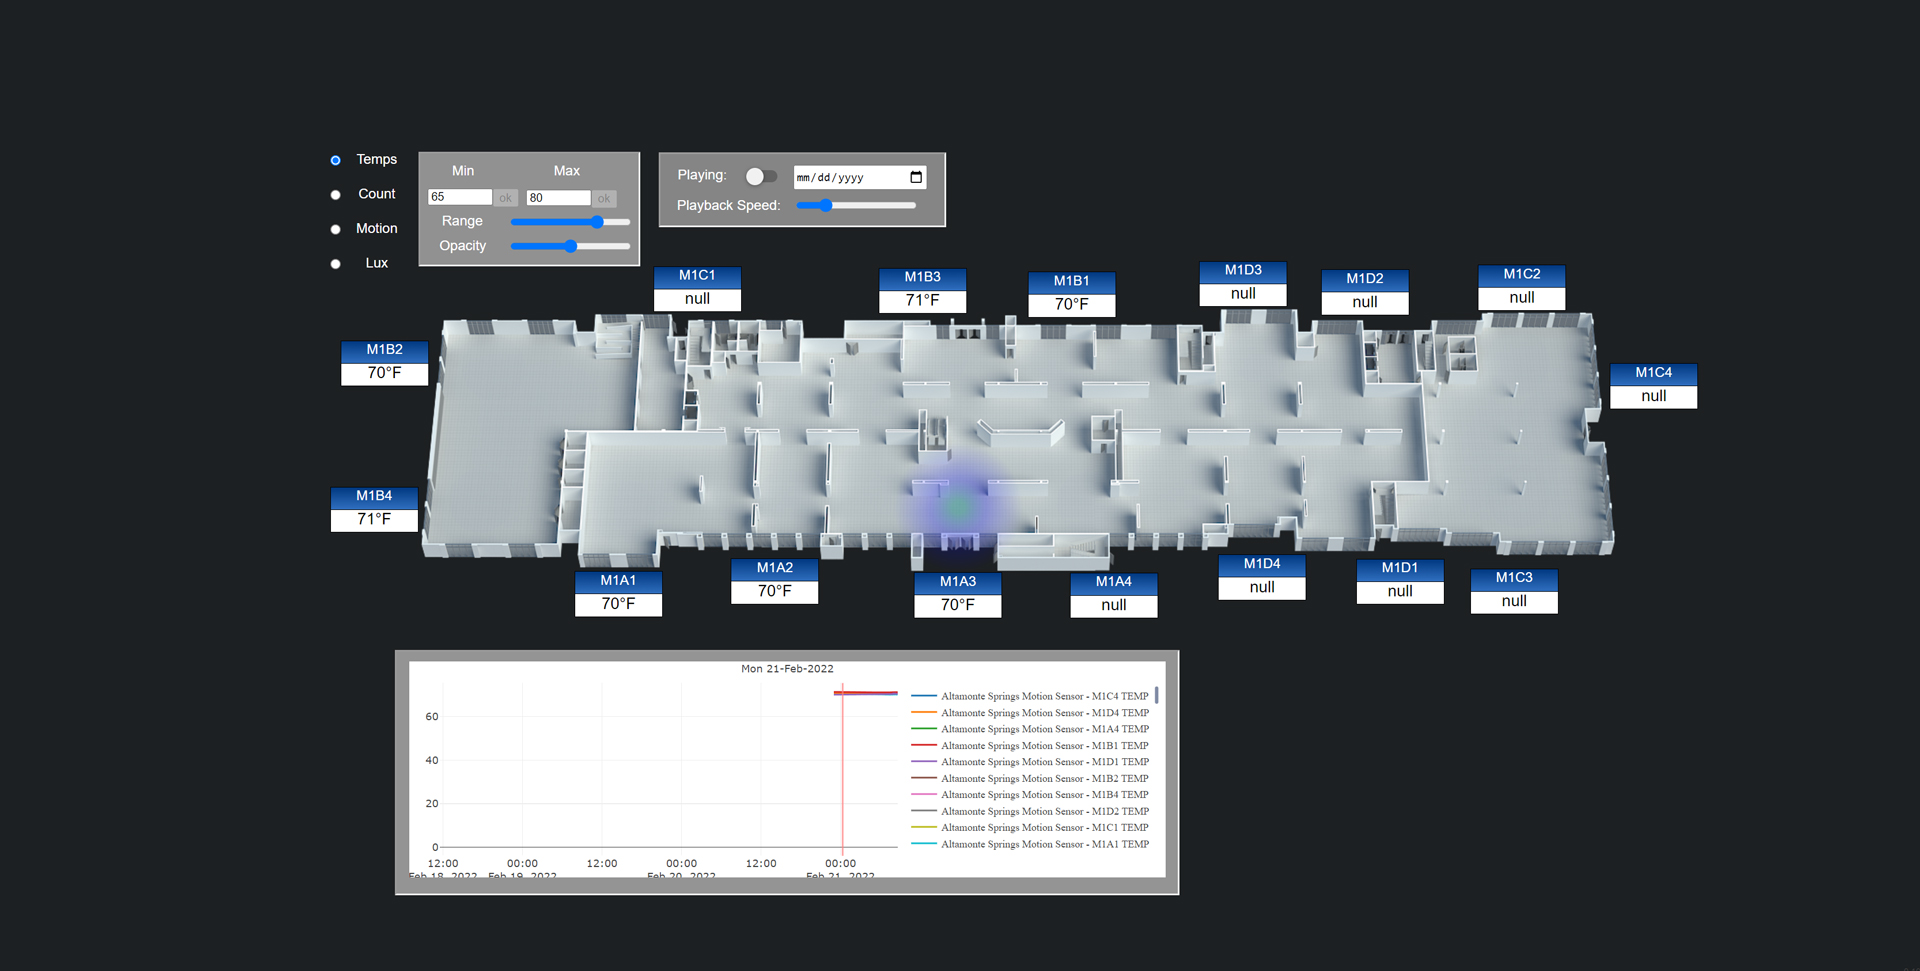
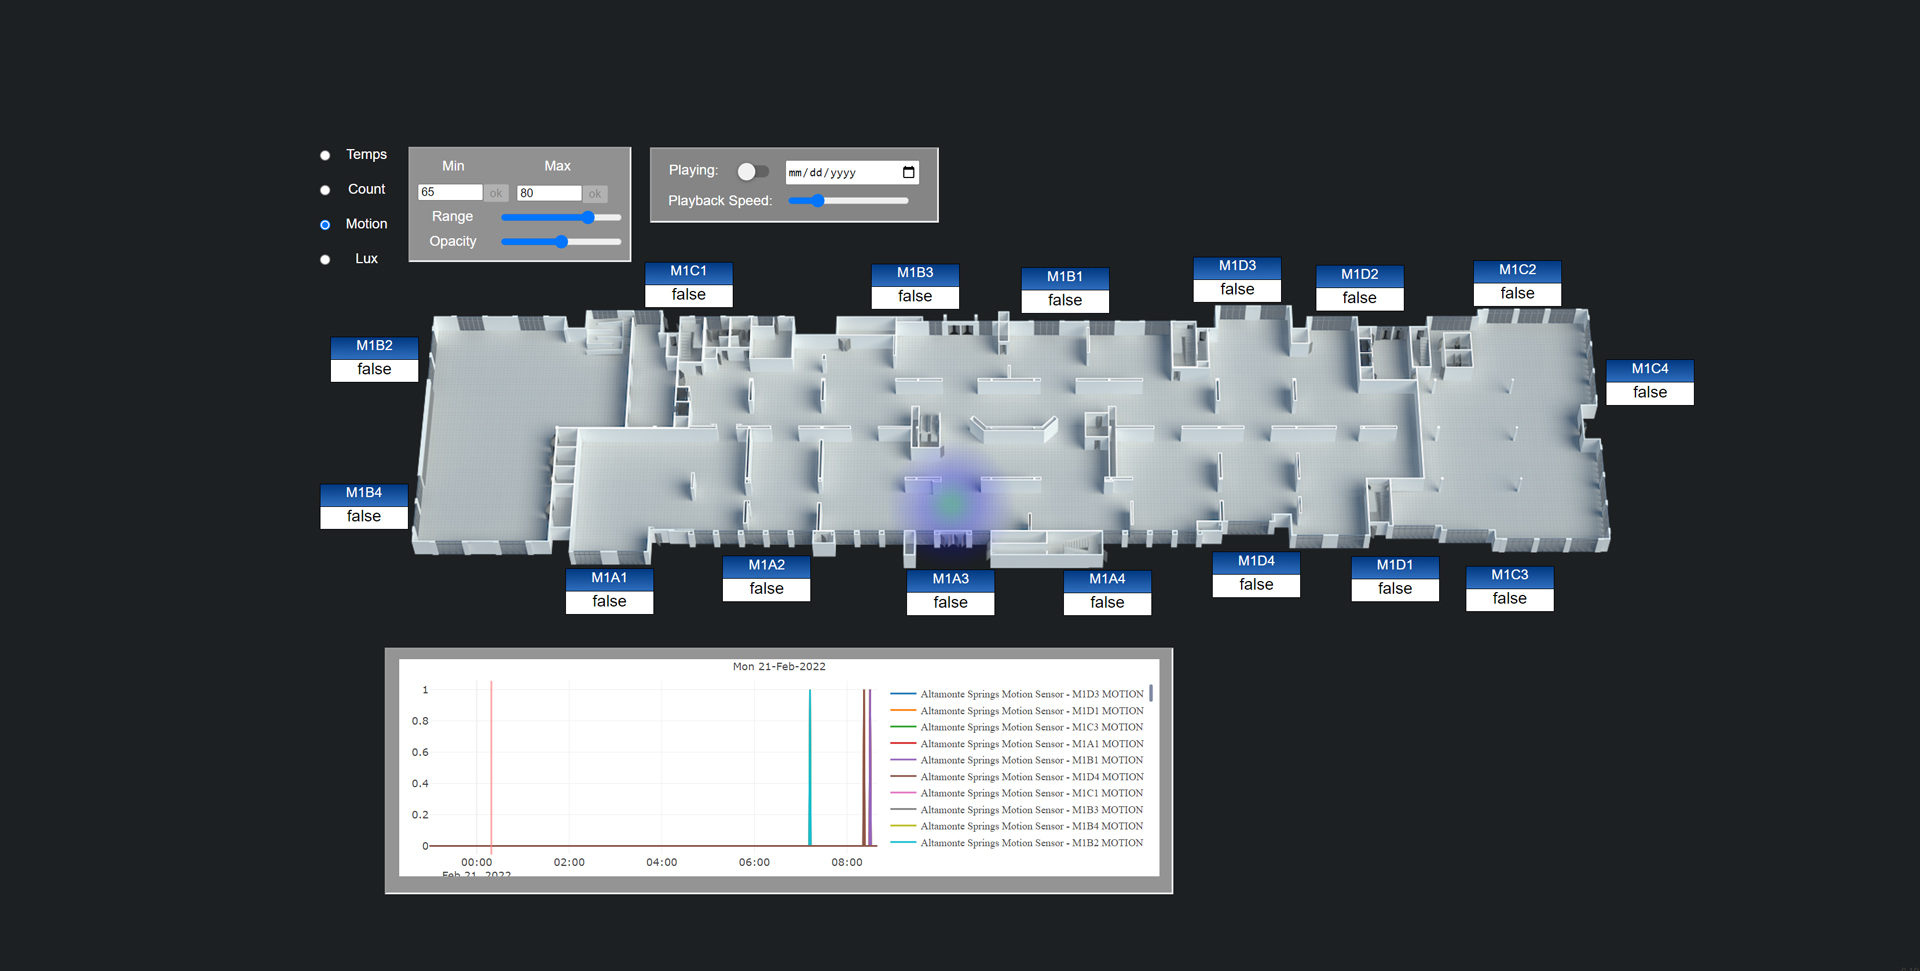
We set up a view of their floorplans to see the temperatures and motion sensors playback in real-time. On SkySpark Floorplan Data and Graphic Integration project, we allowed for the customer to select any date to see how the data played back for that date. We’re able to visualize these changes using a heatmap. As the space got warmer it would be more red and as it got cooler it would be more blue. We gave the ability to switch from looking at temperatures to motion sensors on the fly. It will automatically show you motion sensor values in place of temperatures and show a line graph of all of the motion sensors. This was done to both floors of the building.


