Visualytik
Haystack based IoT Dashboard
Create a custom dashboard for your site
Visualytik is an app to create and display dashboards for your data. Dashboards can contain any graphics, show live data as text, gauges, and grids, show histories on grids and charts, support rich interactions with buttons, sliders, inputs and so on.
Moreover, Visualytik has flow-based programming, so you can make almost anything for your dashboards.
Design
Efficiently
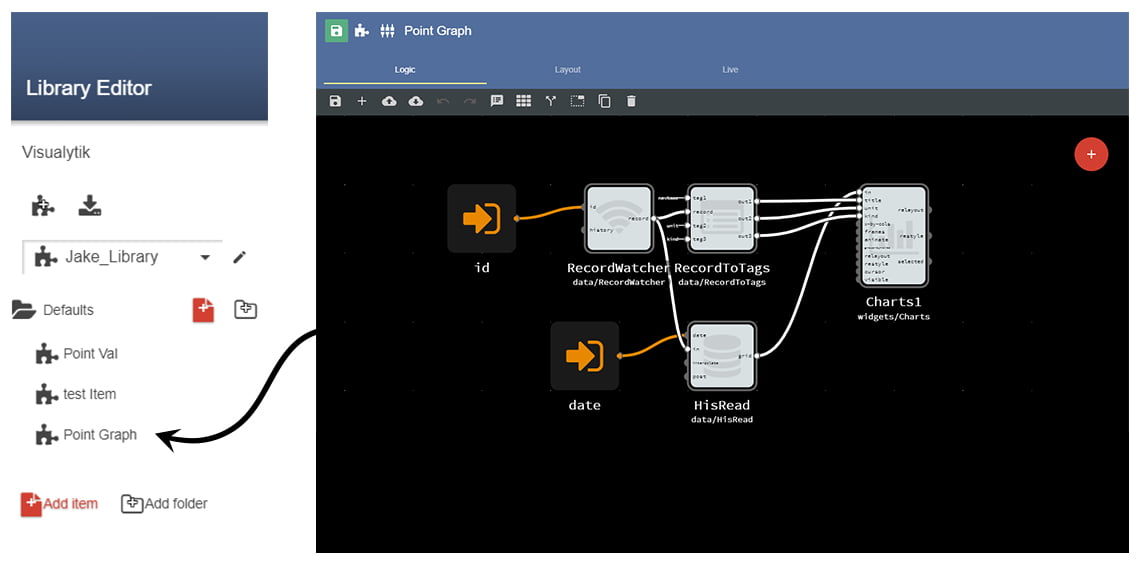
Visualytik gives you the ability to create and reuse widgets you need for your dashboards.
You can create libraries for all the widgets you wish to re-use. You can add logic so that multiple sites can share the same page. Anything you need, can be done quickly and easily using Visualytik.
Dashboard Creation
Smart Widgets
Cluster Aware HayLink
Energy DVR
4D Heatmaps
Create widgets that work for you
Visualytik Smart Widgets enables you to re-use widgets you have configured. You can also create libraries to store all of your widgets. Smart widgets are essential in speeding up your workflow when creating dashboards.
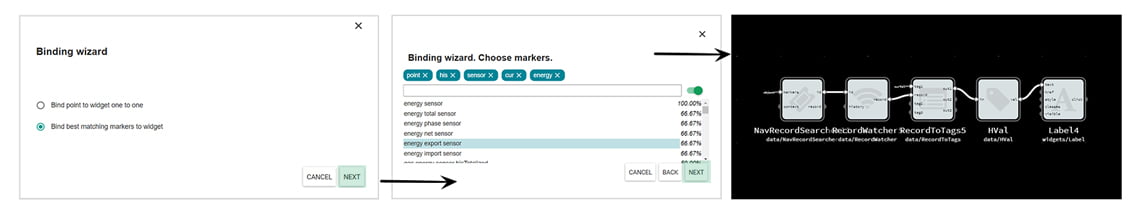
Bind Values with Haystack Tags
Visualytic comes fully equipped to automatically bind your widgets to points using haystack tags. This feature will do most of the heavy lifting for you.
Bind Values with Haystack Tags
Visualytic comes fully equipped to automatically bind your widgets to points using haystack tags. This feature will do most of the heavy lifting for you.
Create Compelling 4D Heatmaps
Visualytik 4D Heatmaps gives you an idea of what is possible with visualytik. For this example,you can make a 4D heatmap that will show the data in your building in a unique yet readable way.
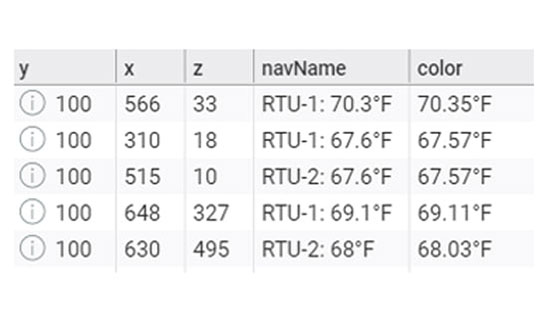
By utilizing our 3D Scatter map, you can create a 4D representation of your data.
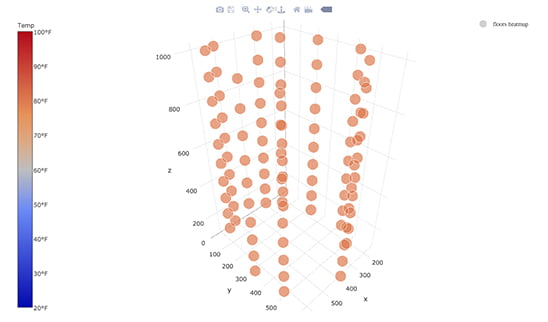
Using this model, you can create a heatmap of all your units in one graph and see which ones are too cold or too hot. When you hover over a point it will display which unit it’s referring to.
To 4D Heatmap
Watch your Data’s past history in Real Time
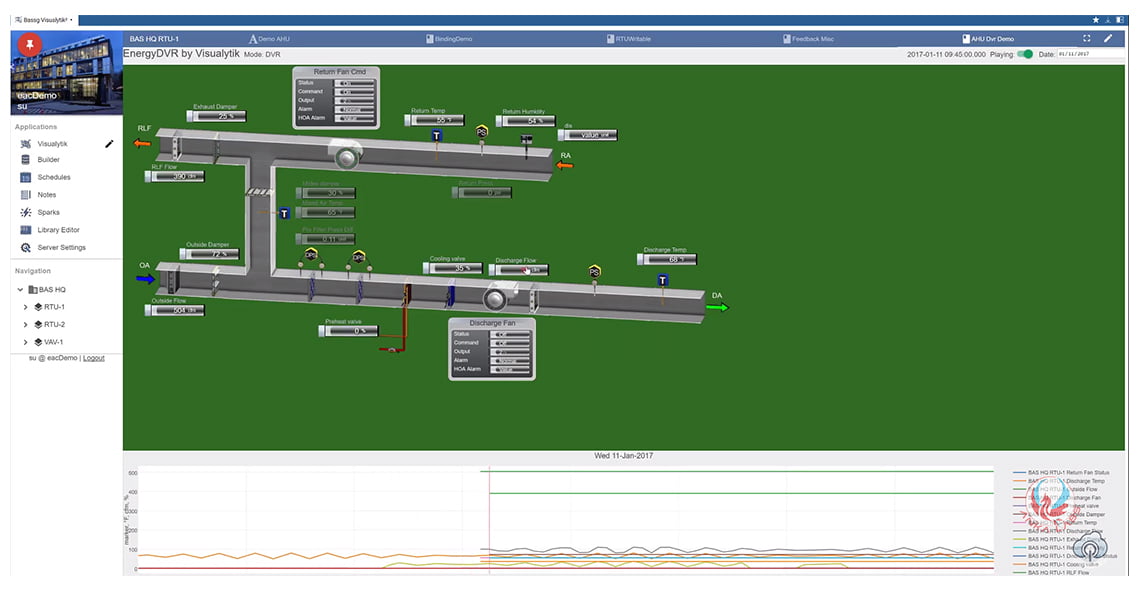
Visualytik’s Energy DVR feature allows the user to see their past data playback in real time. You can go back and watch a blip in your data and compare that to what other data. This feature will allow you to see your data as it really was as if it was live.
Visualytik allows you to be able to roll back the timeline for your data using custom nodes.
The most important of those nodes being the History Player Node. This is the node that will allow you to play through your history.

Using this node you can play back the history of any point on any graphical widget
such as a :
You can even see this history play back on more than one object. So if you want to see your equipment animating while your graph is live you can. This allows you to roll back the clock and see any issues that happened while you were away. Visualytik’s Energy DVR feature shows you just how complex you can get with your dashboards.
Watch your Data?s past history in Real Time
Visualytik?s Energy DVR feature allows the user to see their past data playback in real time. You can go back and watch a blip in your data and compare that to what other data. This feature will allow you to see your data as it really was as if it was live.
Visualytik allows you to be able to roll back the timeline for your data using custom nodes.
The most important of those nodes being the History Player Node. This is the node that will allow you to play through your history.
Using this node you can play back the history of any point on any graphical widget
such as a ?
You can even see this history play back on more than one object. So if you want to see your equipment animating while your graph is live you can. This allows you to roll back the clock and see any issues that happened while you were away. Visualytik?s Energy DVR feature shows you just how complex you can get with your dashboards.
Show your equipment on your dashboard
Visualytik’s BasMaker gives you access to a huge library of assets that can be used to build a variety of equipment.
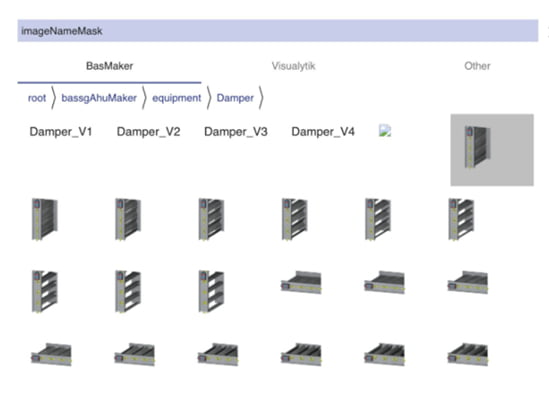
Visualytik’s BasMaker allows you to utilize the Animated Image Widget to create your equipment.
BasMaker gives you access to multiple frames to use so that your equipment can animate.
Visualytik’s BasMaker gives you the ability to create dashboards you know and love in SkySpark.
This makes dashboard creation much easier by providing all the graphics you need right out of the box.
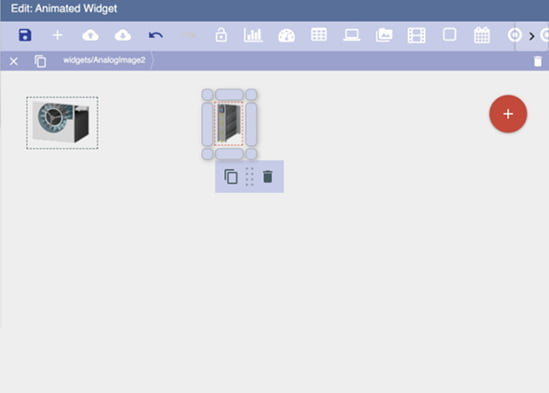
To create an animated Widget
Give context to your points
Whether it be mapping out your thermostats onto floor plans or displaying where your VAVs are throughout your building, Visualytik’s Populating Feature will make your life easier.

How to give your points location values
Visualytik’s Populating gives you the ability to create dashboards you know and love in SkySpark. This makes dashboard creation much easier by providing all the graphics you need right out of the box.
Give context to your points
Whether it be mapping out your thermostats onto floor plans or displaying where your VAVs are throughout your building, Visualytik?s Populating Feature will make your life easier.
How to give your points location values
Visualytik?s Populating gives you the ability to create dashboards you know and love in SkySpark. This makes dashboard creation much easier by providing all the graphics you need right out of the box.

